Portfolio
Quick jumps: Software | Data | Certificates

Assembly
Below are some of my personal favorite projects in Assembly using the RISC‑V Architecture.Path‑finding algorithm (A*) (~1100 lines of code)
If a solution is found, it will be drawn in purple, if not, it will show the paths A* expanded as it tried to find a solution. Diagonal moves are not considered.
Legend: green cells are grass, blue cells are water cells which the algorithm cannot traverse to. Starting cell is colored in red and goal is in orange. Cells that A* expands during the search are in grey.
Demonstration of a map generated in Python and fed directly into the RISC‑V Simulator.
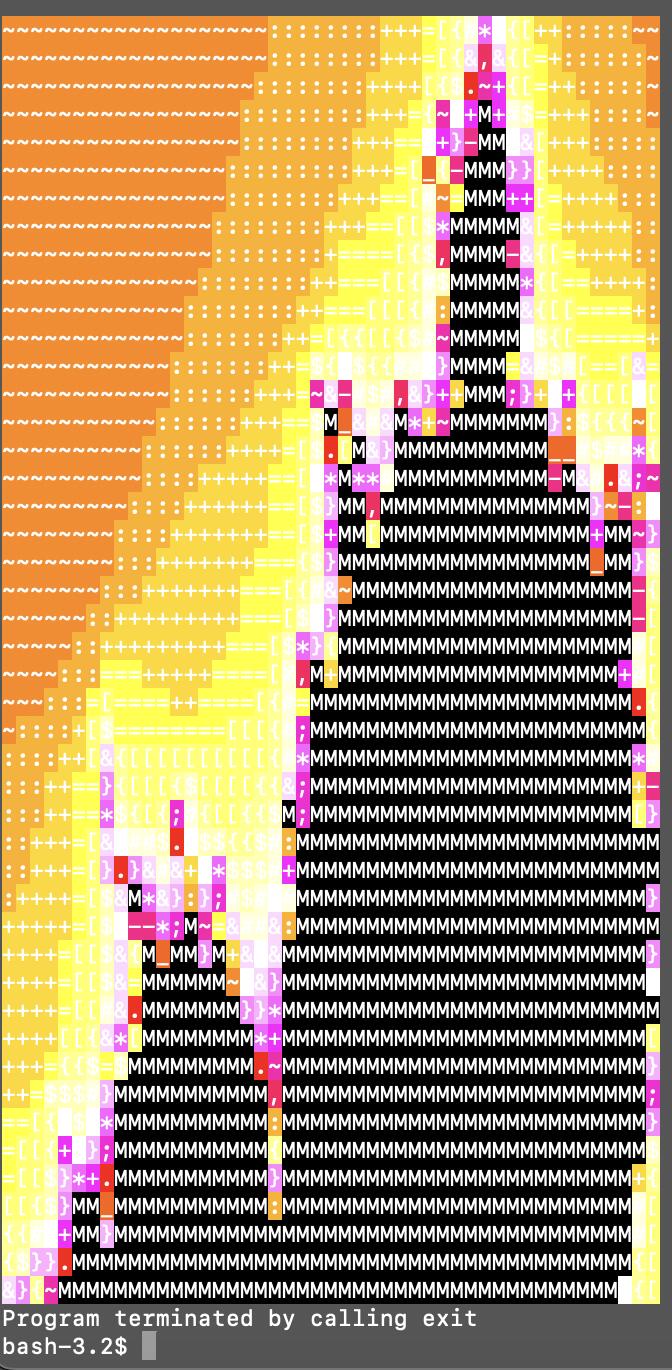
Mandelbrot set
This algorithm renders a fractal given a set of parameters of a Mandelbrot set. Although debugging was the most challenging, the ending was well worth it. The result was achieved using floating point 64‑bit registers & GLIR open library. Output is directly displayed in the terminal.
Black pixels represent complex numbers that didn't escape (complemented with "M"), and the rest represent numbers that did escape on a range of colours and a set of characters.

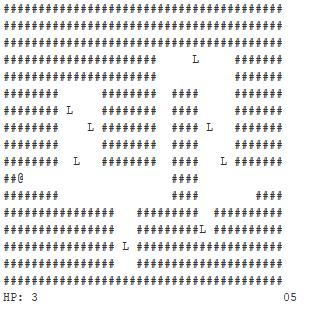
Dungeon Crawler - A 2D Game (~1600 lines of code)
@ is the location of the agent on the map, L stands for loot, and E (Enemy) are hidden until encountered by the agent (@). Asynchronous execution through interrupt and exception handling was used and integrated with game logic. Bottom left is the health points and bottom right is the timer left to reach the final destination.
Java
PlanNet logo
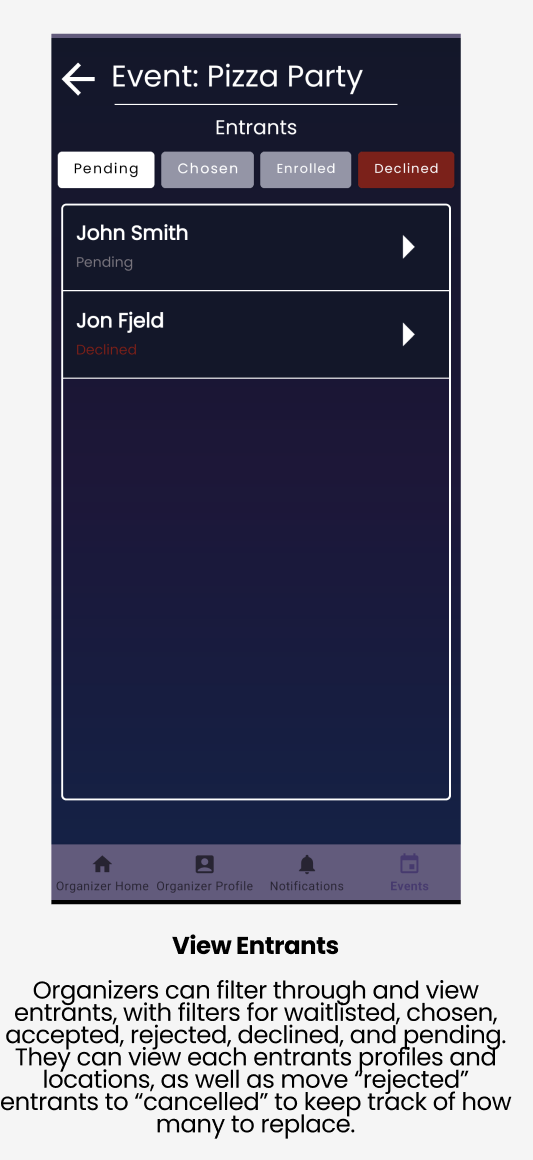
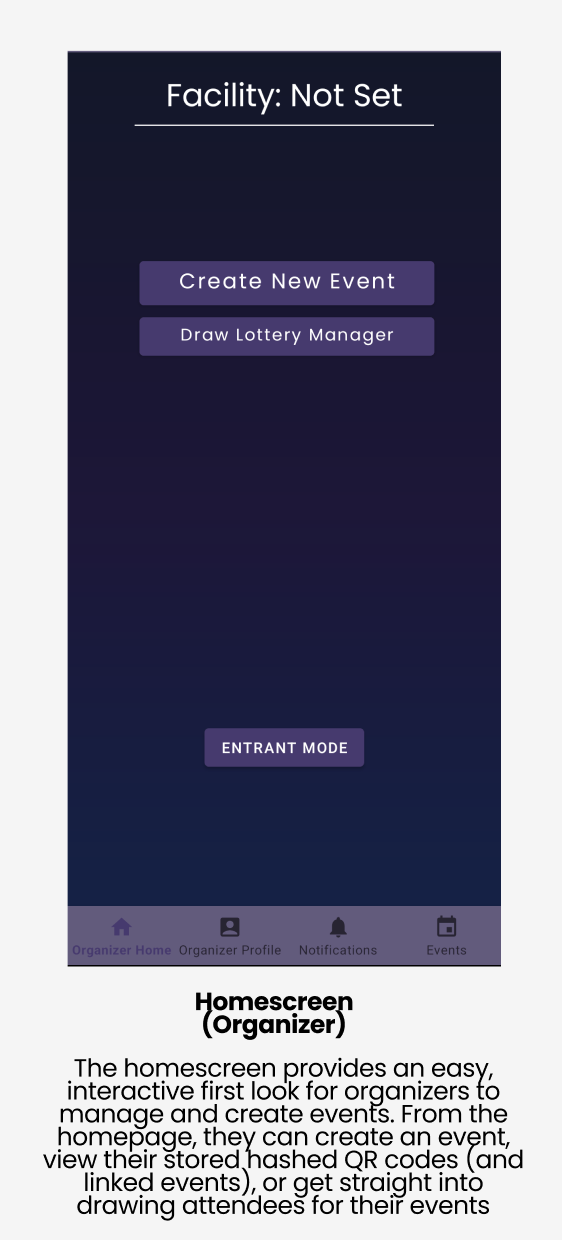
Below are functionality snippets of an android application created in Java that was developed with a team of 5. Scrum practices and adhering to agile principles were a priority in order to foster healthy development. Details of our progress can be found in our wiki repo.
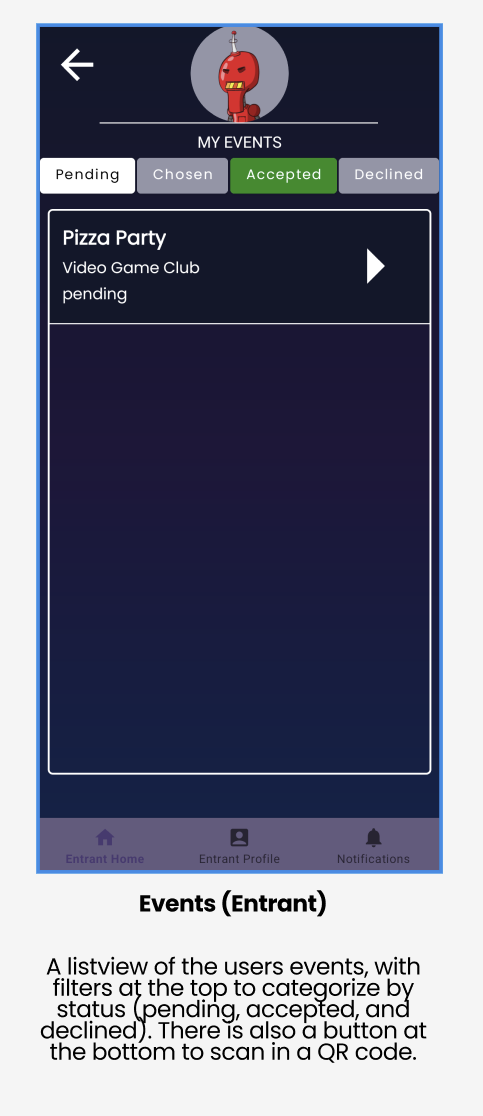
PlanNet is an interactive app which simulates a system of organizers and entrants. Organizers are able to create events with features such as event posters, event dates, QR code generators that send users directly to the event page & more. Entrants act as consumers that sign up for these events. Google Maps API was integrated as part of location restrictions for organizers.

Python
Course Scheduler (BearTracks for UofA)This project populates data related to students & courses, including enrollment information and provides a graphic timetable for the student. Error checking includes invalid student IDs (not found in the database), invalid course names, and duplicate course times when enrolling.
Demonstration:

Cardiovascular Disease Predictions with ML
Below is a demonstration of the Support Vector Machines (SVM) algorithm from the scikit‑learn library for a classification type problem on labeled health data which consists of 70,000 entries. The column "cvd", which was used to train the model, represents the binary value of a cardiovascular disease.
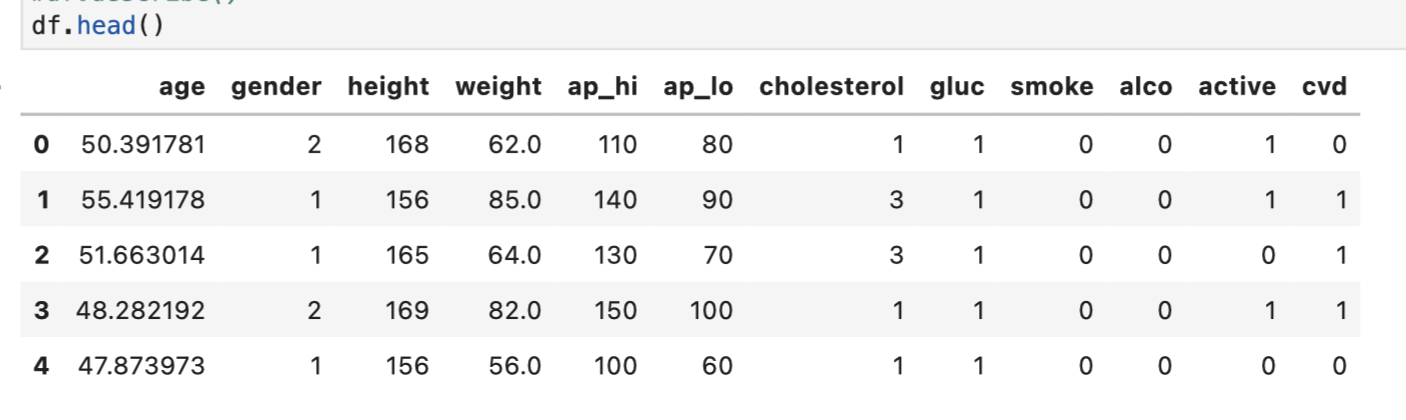
First 5 columns of the data file.
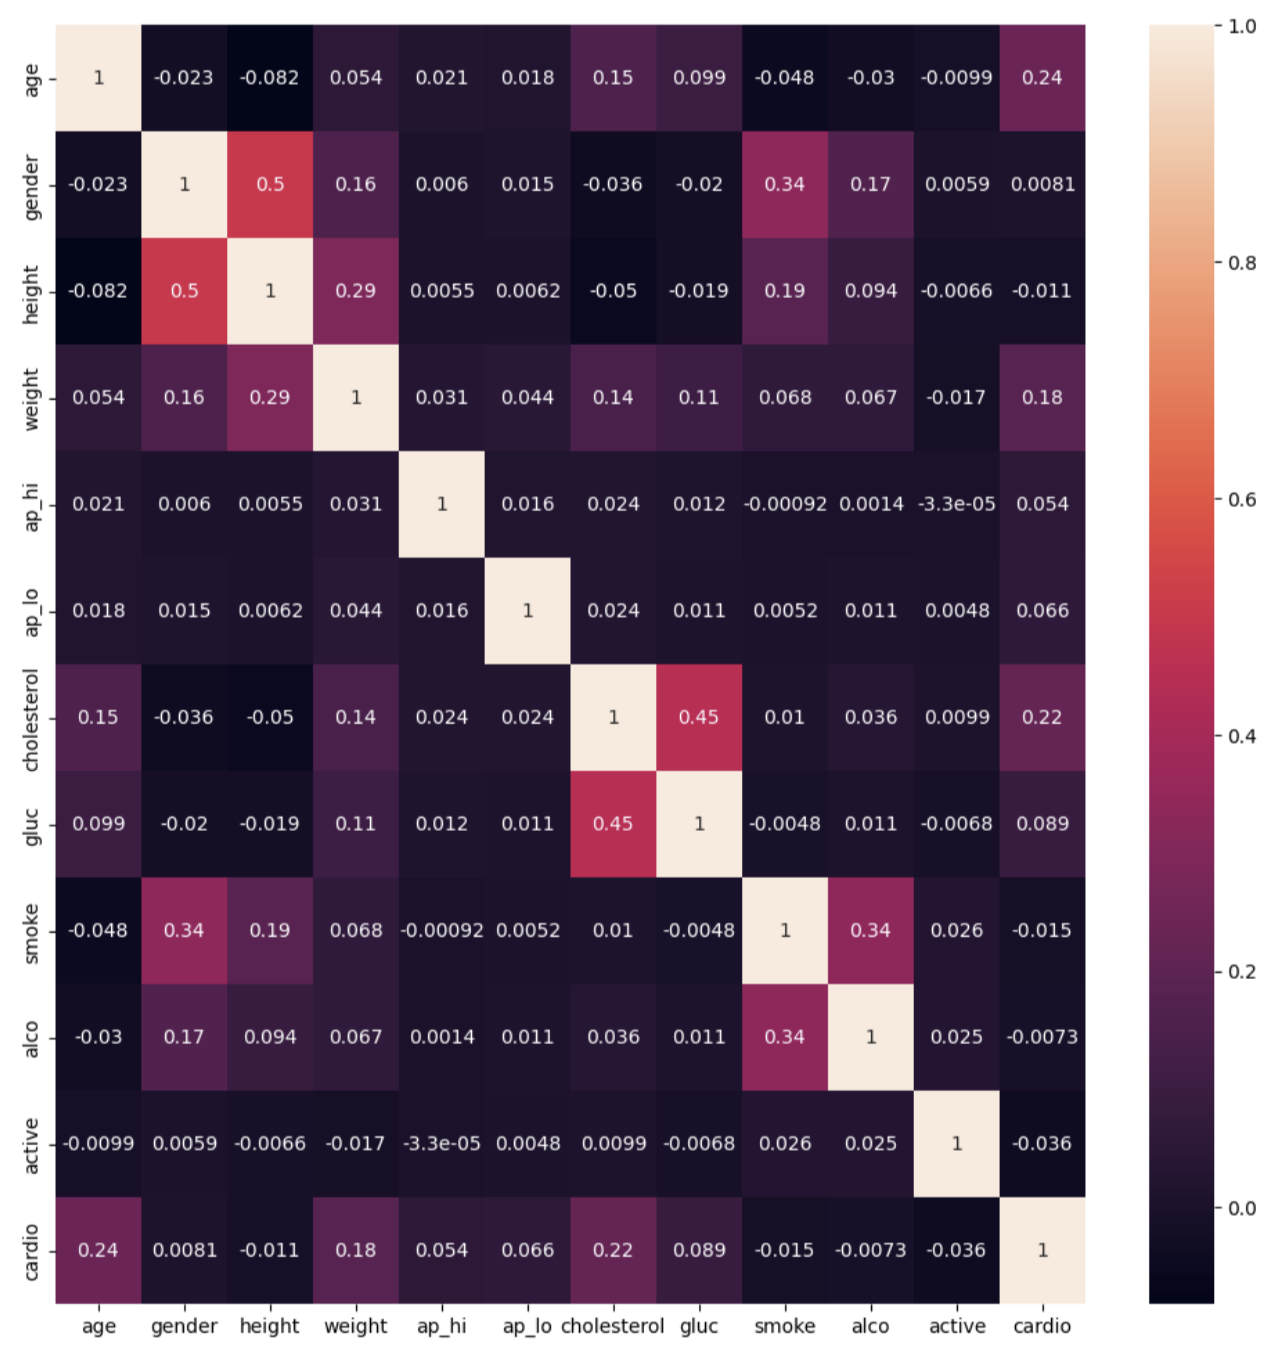
Heatmap of the correlation matrix.
After training/splitting the data, the end result showed a f1‑score of 0.73.
Data Visualization
Below are some graphs that were created in R and Python based on real‑world economic data using data extraction & visualization techniques.
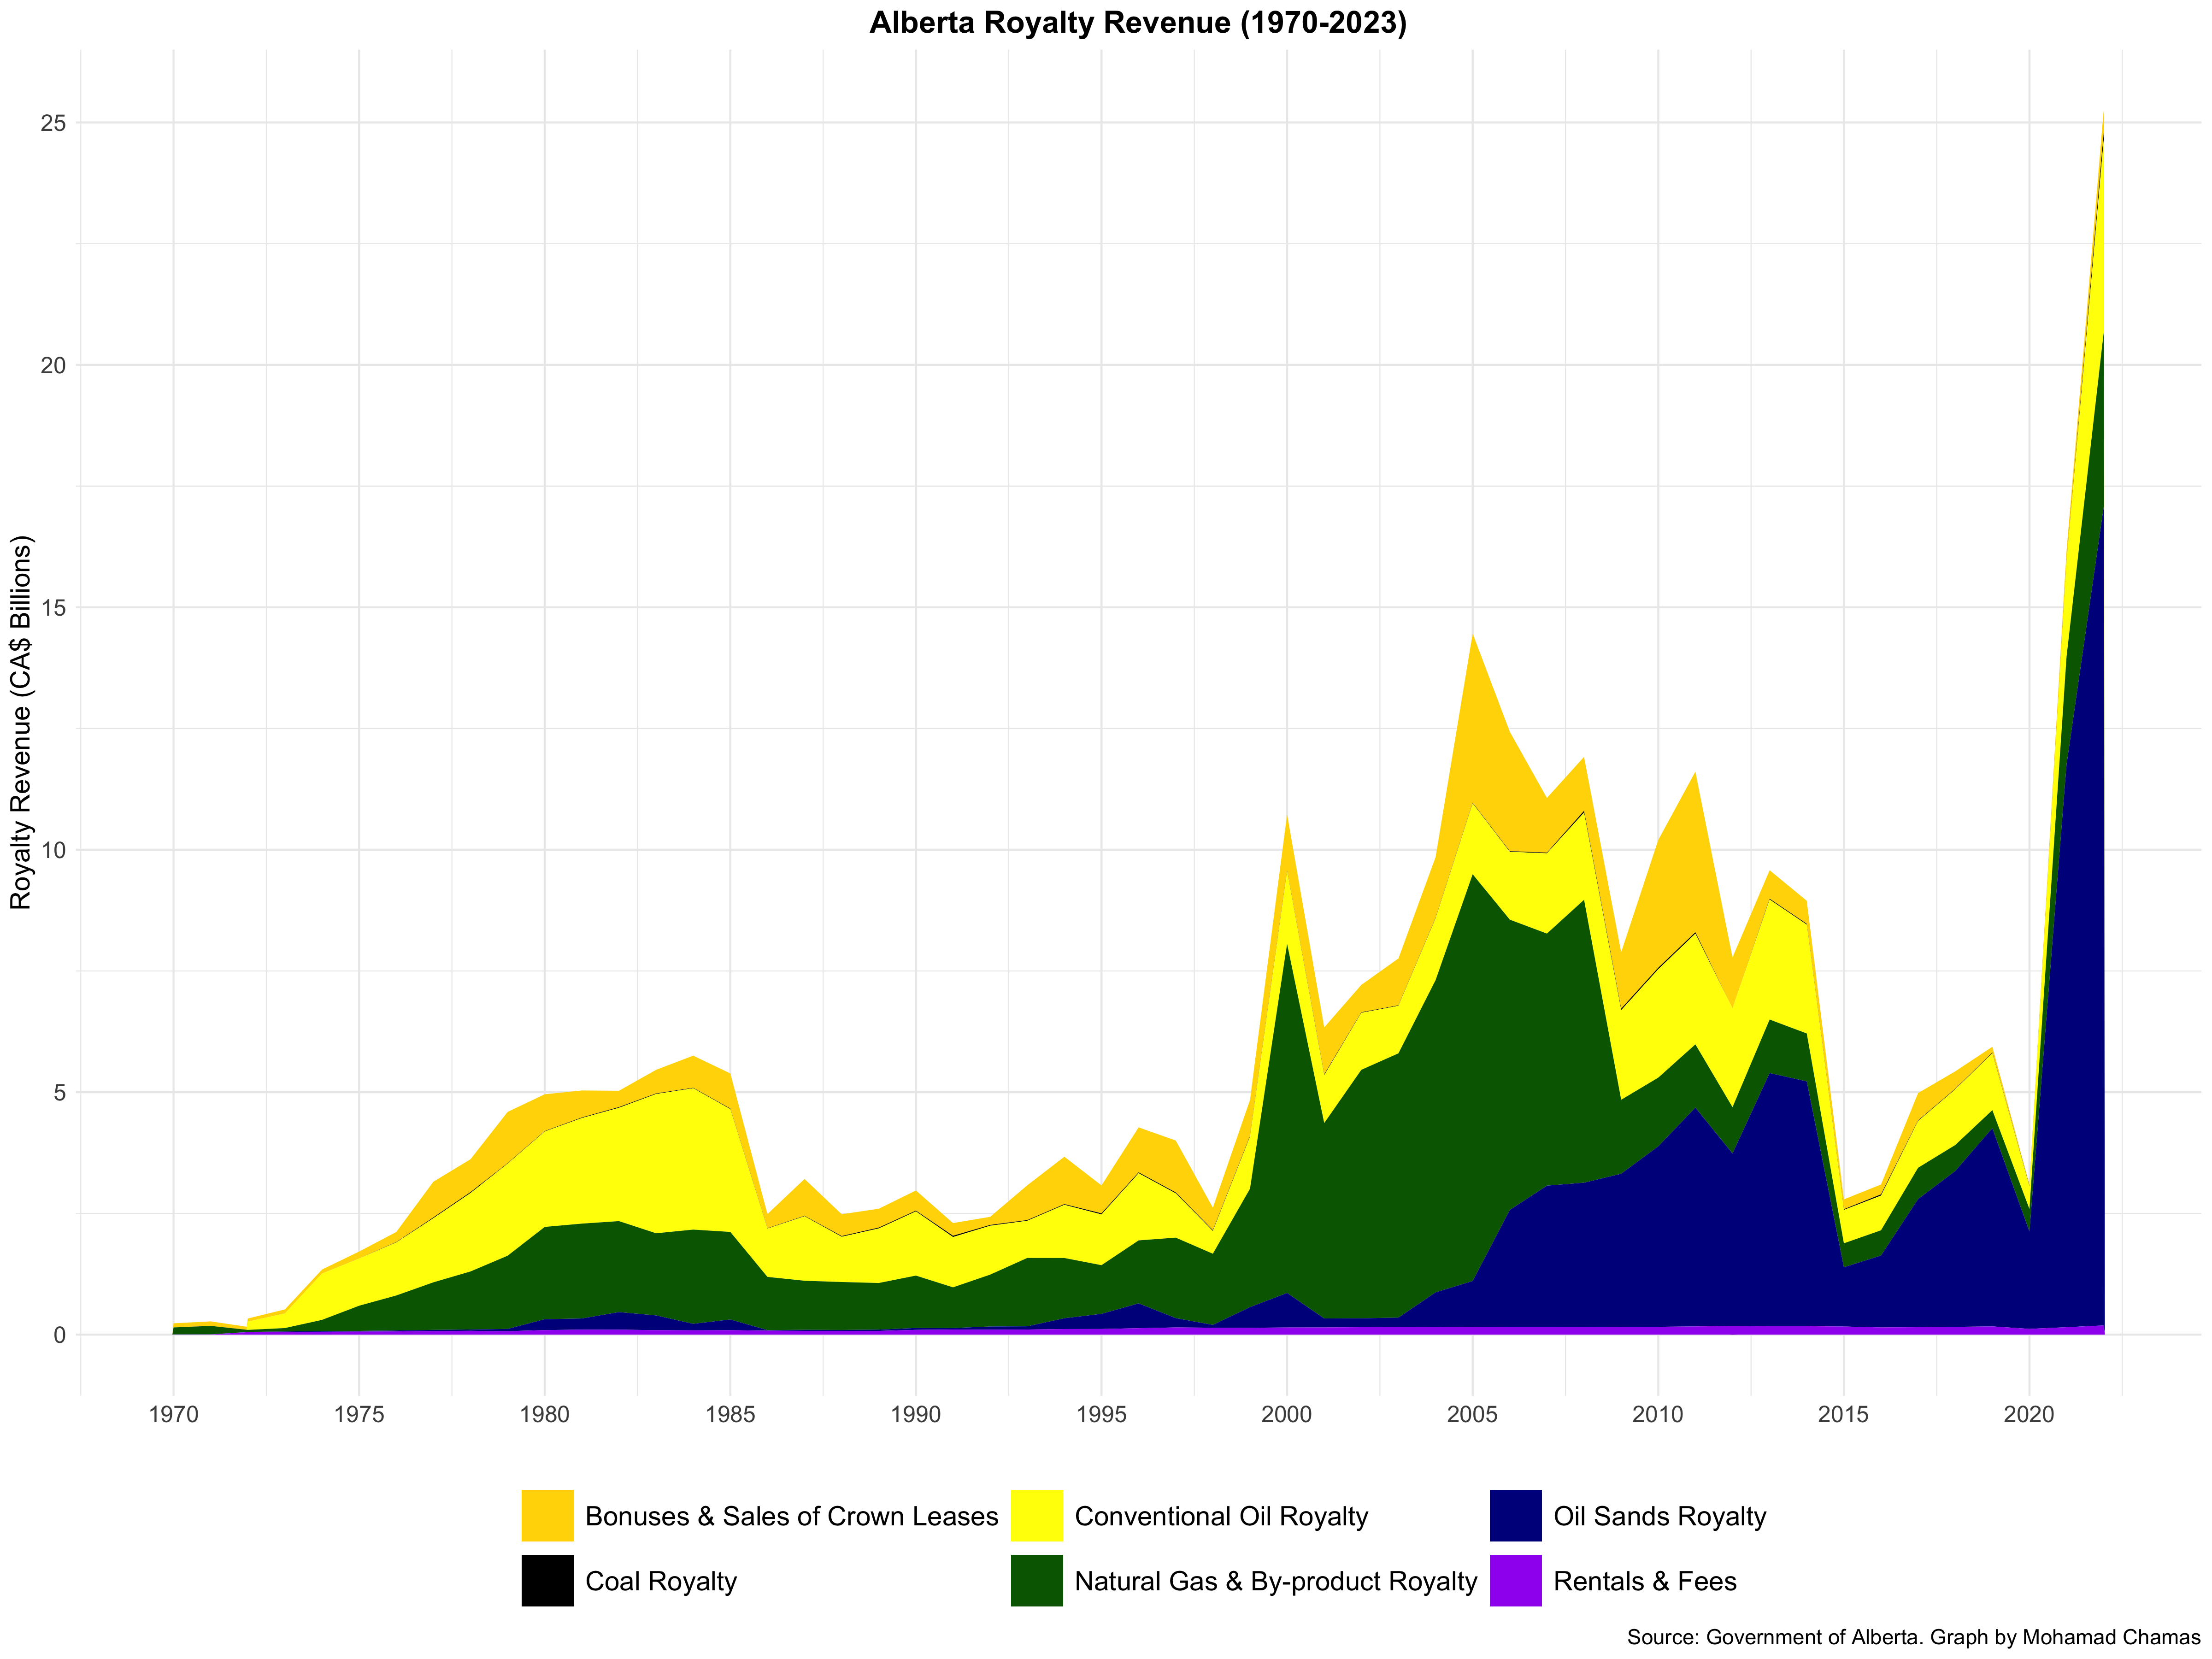
Different drivers of royalty revenues in Alberta dated 1970–2023. Worth noting in the year 2022, Alberta hit record levels for royalty revenues due to higher oil prices.

The following chart depicts the frequency of shipments and products of the TransMountain pipeline.
Fun fact: this pipeline is one of one in North America that carries both crude oil and refined products (e.g. petroleum) in batches.

Django Web Framework
Link: https://coursera.org/share/9d2d89d59ba0211844cb3fb81c824431Back to top